Participatory Systems Mapping helps us to visualize where local actors and interests lie.
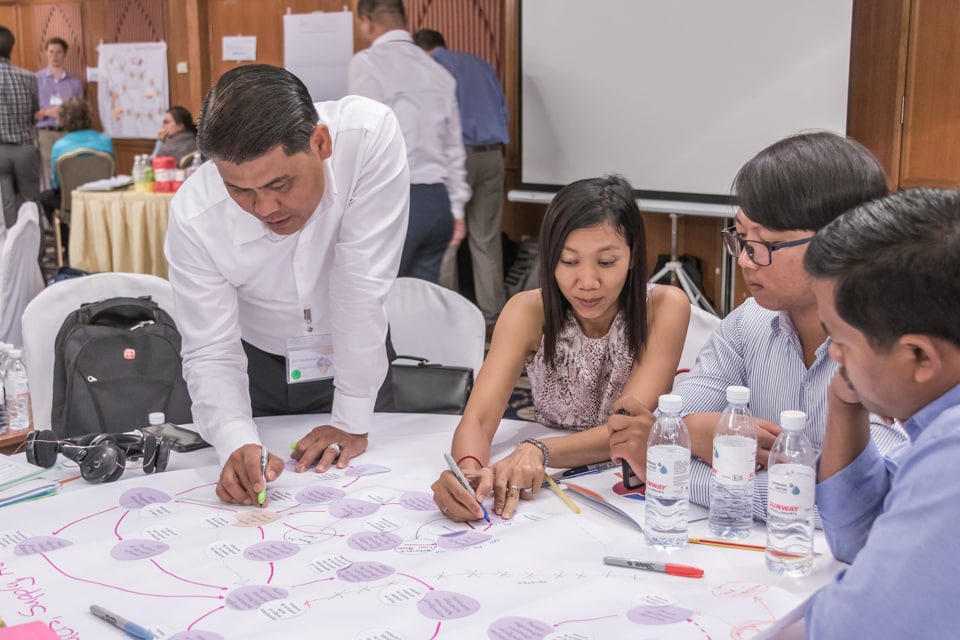
Systems include sets of interconnected actors and issues that form a complex whole. Such systems may include, for example, food or health systems, systems of actors networked around a common objective, market systems, among others. Participatory Systems Mapping (PSM) helps us to visualize where local actors and interests lie, gaining a better understanding of how they may be engaged and benefit from development programming. Typically conducted at the strategy or design phase of an activity, we work to identify and define the system, understand its dynamics and boundaries, and obtain preliminary data and visualizations of where participants fit within it. Oftentimes a part of a larger collective action process, participatory techniques are utilized extensively throughout the process.
Applications and Elements
Participatory Systems Mapping is often our very first step in analyzing a system. It can be conducted as a stand-alone group exercise, or one of several tools to help stakeholders better understand the issues that affect them. The application is iterative and participatory using exercises that engage stakeholders. The process incorporates five key elements:
 Participants: Diverse perspectives and local expertise enable a more complete understanding of the system, while having participants with appropriate authority enables concrete actions to take place.
 Facilitation: The process should foster curiousity among stakeholders to inspire continued learning around their context. This learning is then translated into maps and actionable next steps for the group.
 Boundaries: Understanding a complex system requires setting boundaries. Who and what are in and out? These decisions are important to the success of the process, and should be make deliberately and transparently.
 Co-generation of Knowledge: Different stakeholders will begin the process with a diverse understanding of their own system. We engage stakeholders in the learning process, tapping their knowledge and resources to co-generate maps. They participate in collecting data, community consultations, photos and story-telling.

![]() Visualization: The process often begins with “messy maps” and other basic visual representations of the system including diagrams, maps, and rich pictures. Final maps may take multiple forms, including actor maps, causality maps, stock-and-flow diagrams, issue, and process maps.
Visualization: The process often begins with “messy maps” and other basic visual representations of the system including diagrams, maps, and rich pictures. Final maps may take multiple forms, including actor maps, causality maps, stock-and-flow diagrams, issue, and process maps.
PSM in Action
In Cambodia under the Sustainable WASH Systems Partnership, LINC facilitated system mapping among national level stakeholders in the rural sanitation and hygiene sector. Learn more about the project, read our reports and view the maps. Learn more.
In Guatemala, LINC facilitated a 2-day systems mapping workshop with USAID staff and other democracy and governance experts. Building upon a recently-completed Political Economy Analysis (PEA), the workshop exposed participants to complex systems thinking and resulted in a causal loop diagram to visualize their understanding of the processes and incentives that drive success (and failure) of public service delivery in Guatemala. Learn more.


